8 WAVE
A WAVE IS BORN
HOW WINDS POWER AND SHAPE THE
SURF
Some tiptoe in like the barest
summer breeze. Others crash ashore with the full force of a thousand cymbals,
leaving no doubt about the tremendous power they carry. Their regularity, one after
another after another, can create the most peaceful setting imaginable and
eventually will turn even the hardest rock into sand. They are waves.
TO THE ARTIST AND POET, WAVES ARE BEAUTY packaged in moving water. To the hardened
sailor, they are things to respect and fear. And to the surfer, waves are the
stuff of awe, legend, and experiences approaching rapture. But in fact, waves
are just energy moving through the water.
A wave is born when some natural phenomenon imparts energy
to water. That energy source can be something dramatic, such as an underwater
earthquake, volcano, or landslide, and the resulting waves can tower 100 feet
above the sea. Earthquakes and volcanoes are rare, and landslides are only
slightly more common; together they produce fewer than one percent of all
waves. Instead, it is the wind blowing on the surface of the water that sets
most waves in motion, though the wind, too, can generate so-called killer
waves.
Such was the case with the great Halloween storm of 1991,
which produced the largest waves ever documented—150 feet tall, surpassing the old record of 112 feet set
in 1933. An enormous low-pressure system parked off the
“It was a stupendous display unlike anything I’ve ever seen,” says Dally, an avid surfer and Florida Institute of Technology professor
“The whole town of
How were such enormous waves born? Their genesis began
with the wind blowing across the
On an average day at sea, wind-driven waves are about five
to ten feet high, measured from the top or crest, of the wave to the lowest
point, or trough, in front of the wave. But this was no average day at sea, for
a storm was passing overhead.
During the typical ocean storm, strong winds might force
the water to pile up in waves that crest at 70 feet or more. Certainly, these
are big waves, although they would begin decaying as soon as they moved away
from the storm. But this was no typical storm.
THIS WAS A MONSTER STORM WITH THE THREE TRAITS THAT MAKE
FOR RECORD-BREAKING WAVES: It had fairly strong winds that blew for a long time and
over a great distance, or fetch.
“Strong winds alone produce big waves, but not enormous waves,” says Rick Grigg, the 1967 world surfing champion who now
is a professor of oceanography at the
On Halloween 1991, winds blowing just under 70 knots
whipped the seas into what is called a fully developed stage. Large, slanted
waves, some with whitecaps, moved southward from the storm. But this storm had
an enormous fetch so the winds continued to push against the waves, piling them
ever higher.
Even this storm had its edge, however, and once the waves
crossed that edge they coalesced into swells. These are the rounded form of
waves that can travel thousands of miles over the course of two weeks or more.
Swells are tame compared to the waves of a fully developed sea, but they carry
just as much energy as their violent progenitors. Instead of being tall, they
are wide—the distance between troughs increases as
the waves of a fully developed sea turn into swells.
From a ship, swells appear to be traveling hills of water,
but the water in a swell travels little, if any, through the open ocean.
Instead, it is the energy imparted from the wind that moves through the water—at speeds of 25 miles per hour—causing the water to rise and fall in place as the energy
passes. If this is hard to fathom, think of those amber waves of grain: The
wheat doesn’t actually move through the field even
though it appears to do just that.
Left to its own devices, a swell will travel through the
ocean, losing some of its energy as friction with each passing mile until it
ceases to exist. Occasionally, swells from different storms may cross each
other’s path. If the crests of the two sets of
swells intersect, they will combine into one set of gigantic swells called
rogue waves. Though short-lived, rogue waves can capsize ocean-going ships.
If the initial wave is large, the swell can travel several
thousand miles before it dies.
Eventually, though, most swells pass close to land. There,
what’s known as the swell’s cone of energy—the energy beneath the water’s surface—hits the seafloor, which forces the cone
toward the surface. As the energy rises so, too, does the top of the swell, and
it once again becomes a wave. As the wave moves further ashore, two things
happen.
First, the wave slows as its cone of energy drags along
the seafloor, and as a result, the wave turns toward shore. This is called
refraction, and it is the reason that waves come ashore parallel to the
shoreline. It is the same phenomenon that causes light waves to bend as they
pass from air into water.
At the same time, the sea bottom continues to push upward
on the cone of energy, forcing the wave crest to grow ever higher until it
becomes unstable. It is then that the wave breaks: The crest curls over and
produces a whitecap or spindrift. It is here, beneath the whitecap on the part
of the wave known as the tunnel or pipeline, that the surfer catches and rides
a wave.
THIS INTERACTION BETWEEN THE CONE OF ENERGY AND THE
SEAFLOOR DETERMINES, TO A LARGE PART, WHETHER WAVES ROLL ASHORE GENTLY or form the big breakers that surfers
love to ride. Where the seafloor rises gradually, waves build gradually and
eventually spill onto the beach. But if the seafloor rises suddenly, or if
there are reefs or shoals not far from the shore, then the waves plunge forward
as their energy is thrust upward. Appropriately placed undersea canyons also can
focus wave energy much like a lens.
Dally has studied the interactions between seafloor and
surfability and, together with some colleagues at Florida Tech, has developed a
computer program that can predict what surfing conditions will be like three
days in advance. Dally starts by determining a beach’s Iribarren number, a constant that relates the slope of
the seafloor at a particular beach to the average wave size at that beach. A
larger Iribarren number means that the beach is more likely to have plunging
breakers, which is what surfers desire.
The wave forecaster runs the data on barometric pressure
and wind speeds through a sophisticated numerical model of the
Though some surfers may disagree, Stephan Grilli, an avid
sail surfer and assistant professor of ocean engineering at the
Good as the
In all his 40-some years of surfing, Grigg says that he has
seen waves of 30 feet only five times. In 1981 he tried surfing one of them and
broke a bone in his back in the process. He still surfs as often as he can, but
30 footers are now just for watching in amazement.
“Seeing one takes your breath away,” says Grigg.
![]()
Joseph Alper is a free-lance writer whose works
appear in The Los Angeles
Times, The Atlantic Monthly, Science, and Sea Frontiers.
|
From
Sea Frontiers, Vol. 39, 1993. © 1993 by the International
Oceanographic Foundation. Reprinted by permission.
|
9 OCEAN WAVES
Men
have always been fascinated, and sometimes awed, by the rhythmic motions of the
seas surface. A century of observation and experiment has revealed much about
how these waves are generated and propagated
By
Willard Bascom
|
M |
an is by nature a wave-watcher. On a ship he finds himself
staring vacantly at the constant swell that flexes its muscles just under the
sea's surface; on an island he will spend hours leaning against a palm tree
absently watching the rhythmic breakers on the beach. He would like to learn
the ways of the waves merely by watching them, but he cannot, because they set
him dreaming. Try to count a hundred waves sometime and see.
Waves are not always so hypnotic. Sometimes they fill us with
terror, for they can be among the most destructive forces in nature, rising up
and overwhelming a ship at sea or destroying a town on the shore. Usually we
think of waves as being caused by the wind, because these waves are by far the
most common. But the most destructive waves are generated by earthquakes and
undersea landslides. Other ocean waves, such as those caused by the
gravitational attraction of the sun and the moon and by changes in barometric
pressure, are much more subtle, often being imperceptible to the eye. Even
such passive elements as the contour of the sea bottom, the slope of the beach
and the curve of the shoreline play their parts in wave action.; A wave becomes
a breaker, for example, because as it advances into increasingly shallow water
it rises higher and higher until the wave front grows ton steep and topples
forward into foam and turbulence. Although the causes of this beautiful
spectacle are fairly well understood, we cannot say the same of many other
aspects of wave activity. The questions asked by the wave-watcher are
nonetheless being answered by intensive studies of the sea and by the
examination of waves in large experimental tanks. The new knowledge has made it
possible to measure the power and to forecast the
actions
of waves for the welfare of those who live and work on the sea and along its
shores.
Toss a pebble into a pond and watch the even train of waves go
out. Waves at sea do not look at all like this. They are confused and
irregular, with rough diamond-shaped hillocks and crooked valleys. They are so
hopelessly complex that 2,000 years of observation by seafarers produced no
explanation beyond the obvious one that waves are somehow raised by the wind.
The description of the sea surface remained in the province of the poet who
found it "troubled, unsettled, restless. Purring with ripples under the caress of a breeze, flying into
scattered billows before the torment of a storm and flung as raging surf
against the land; heaving with tides breathed by a sleeping giant."
The motions of the oceans were too complex for intuitive
understanding. The components had to be sorted out and dealt with one at a
time. So the first theoreticians cautiously permitted a perfect train of
waves, each exactly alike, to travel endlessly across an infinite ocean. This
was an abstraction, but it could at least be dealt with mathematically.
Early observers noticed that passing waves move floating
objects back and forth and up and down, but do not transport them horizontally
for any great distance. From the motion of seaweeds the motion of the water
particles could be deduced. But it was not until 1802 that Franz Gerstner of
The first wave experimentalists were Ernst and Wilhelm Weber
of
As increasingly bolder workers contributed
ideas in the 20th century, many of the complexities of natural waves found
their way into equations. However, these gave only a crude, empirical answer
to the question of how wind energy is transferred to waves. The necessity for
the prediction of waves and surf for amphibious operations in World War TI
attracted the attention of Harald U. Sverdrup and
Walter Munk of the Scripps Institution of
Oceanography. As a result of their wartime studies of the interaction of winds
and waves they were the first investigators to give a reasonably complete quantitative
description of how wind gets energy into the waves. With this description wave
studies seemed to come of age, and a new era of research was launched.
Let us follow waves as they are generated at sea by the wind,
travel for perhaps thousands of miles across the ocean and finally break
against the shore. The effectiveness of the wind in making waves is due to
three factors: its average velocity, the length of time it blows and the extent
of the open water across which it blows (called the fetch).
Waves and the Wind
Waves start up when the frictional drag of a breeze on a calm
sea creates ripples. As the wind continues to blow, the steep side of each
ripple presents a surface against which the moving air can press directly.
Because winds are by nature turbulent and gusty, wavelets of all sizes are at
first created. The small, steep ones break, forming whitecaps, releasing some
of their energy in turbulence and possibly contributing part of it to larger
waves that overtake them. Thus as energy is added by the wind the smaller
waves continually give way to larger ones which can store the energy better.
But more small waves are continually formed, and in the zone where the wind
moves faster than the waves there is a wide spectrum of wavelengths. This is
the generating area, and in a large storm it may cover thousands of square
miles. If storm winds apply more force than a wave can accept, the crest is
merely steepened and blown off, forming a breaking wave at sea. This happens
when the wave crest becomes a wedge of less than 120 degrees and the height of
the wave is about a seventh of its length. Thus a long wave can accept more
energy from the wind and rise much higher than a short wave passing under the
same wind. When the wind produces waves of many lengths, the shortest ones
reach maximum height quickly and then are destroyed, while the longer ones
continue to grow.
A simple, regular wave-train can be described by its period
(the time it takes two successive crests to pass a point), by its wavelength
(the distance between crests) and by its height (the vertical distance between
a trough and a succeeding crest). Usually, however, there are several trains
of waves with different wavelengths and directions present at the same time,
and their intersection creates a random or a short-crested diamond pattern.
Under these conditions no meaningful dimensions can be assigned to wave period
and length. Height, however, is important, at least to ships; several crests
may coincide and add their heights to produce a very large wave. Fortunately
crests are much more likely to coincide with troughs and be canceled out. There
is no reason to believe that the seventh wave, or some other arbitrarily
numbered wave, will be higher than the rest; that is a myth of the sea.
Since waves in a sea are so infinitely variable,. statistical methods must be employed
to analyze and describe them. A simple way to describe height, for example, is
to speak of significant height-the average height of the highest third of the
waves. Another method, devised in 1952 by Willard J. Pierson, Jr., of
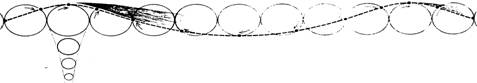
CROSS SECTION OF OCEAN WAVE
traveling from left to right shows wavelength as distance between successive
crests. The time it takes two crests to pass a point is the wave period.
Circles are orbits of water particles in the wave. At the surface their
diameter equals the wave height. At a depth of half the wavelength (left), orbital diameter is only 4 per
cent of that at surface.
frequency and
direction. Then, by determining the portion of the spectrum in which most of
the energy is concentrated, the average periods and lengths can be obtained
for use in wave forecasting.
Over a long fetch, and under a strong, steady wind, the longer
waves predominate. It is in such areas of sea that the largest wind waves have
been recorded. The height of the waves in a train does not, however, bear any simple
relationship to their other two dimensions: the period and the wavelength. The
mariner's rule of thumb relates wave height to wind velocity and says that the
height ordinarily will not be greater than half the wind speed. This means that
an 80-mile-per-hour hurricane would produce waves about 40 feet high.
The question ,of just how
large individual waves at sea can actually be is still unsettled, because
observations are difficult to make and substantiate from shipboard in the midst
of a violent storm. Vaughan Cornish of England spent half a century collecting
data on waves, and concluded that storm waves over 45 feet high are rather
common. Much higher waves have been fairly well authenticated on at least two
occasions.
In October, 1921, Captain Wilson
of the 12,000-ton S.S. Ascanius reported an extended storm in which the
recording barometer went off the low end of the scale. When the ship was in a
trough on an even keel, his observation post on the ship was 60 feet above the
water level, and he was certain that some of the waves that obscured the
horizon were at least 10 feet higher than he was, accounting for a total
height of 70 feet or more. Commodore Hayes of the S.S. Majestic reported in February, 1923, that his ship had experienced
winds of hurricane force and waves of 80 feet in height. Cornish examined the
ship, closely interrogated the officers and concluded that waves 60 to 90 feet
high, with an average height of 75 feet, had indeed been witnessed.
A wave reported by Lieutenant Commander R. P. Whitemarsh in the Proceedings
of the U. S. Naval Institute tops all others. On February 7, 1933, the U.S.S. Ramapo, a Navy tanker 478 feet
long, was en route from
As waves move out from under the winds that raise them, their
character changes. The crests become lower and more rounded, the form more
symmetrical, and they move in trains of similar period and height. They are
now called swell, or sometimes ground swell, and in this form they can travel
for thousands of miles to distant shores. Happily for mathematicians, swell
coincides much more closely with classical theory than do the waves in a rough
sea, and this renews their faith in the basic equations.
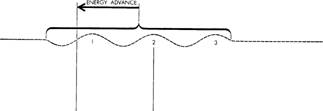
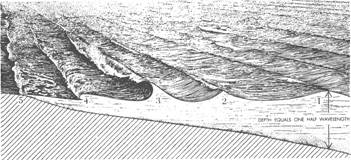
WAVE
ADVANCE
MOVING TRAIN OF WAVES advances at only half
the speed of as its individual waves. At top is a wave train in its first
position. At bottom the train, and its energy, have moved only half as far as
wave 2 has. Meanwhile wave 1 has died, but wave 4 has formed at the rear of the
train to replace it. Waves arriving at shore are thus remote descendants of
waves originally generated.
5
 =
= 
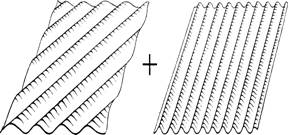
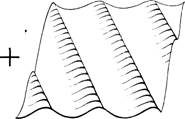
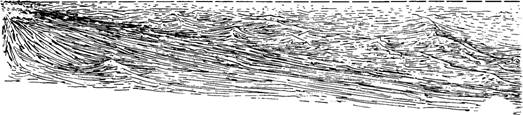
DIFFERENT
TRAINS OF WAVES, caused by winds of
different directions and strengths, make up the surface of a "sea."
The various trains, three of which are represented diagrammatically here, have
a wide spectrum of wavelengths, heights and directions. When they meet, the result is apparent
confusion, represented at far right by a topographic diagram drawn from actual
photographs of the sea surface. The pattern
becomes so complex that statistical methods must be used to analyze the
waves and predict their height.
Curiously enough, although each wave moves
forward with a velocity that corresponds to its length, the energy of the group
moves with a velocity only half that of the individual waves. This is because
the waves at the front of a group lose energy to those behind, and gradually
disappear while new waves form at the rear of the group. Thus the composition
of the group continually changes, and the swells at a distance are but remote
descendants of the waves created in the storm [see illustration on preceding page]. One can measure the period
at the shore and obtain from this a correct value for the wave velocity;
however, the energy of the wave train traveled from the storm at only half that
speed.
Waves in a swell in the
open ocean are called surface waves, which are defined as those moving in
water deeper than half the wavelength. Here the bottom has little or no effect
on the waves because the water-particle orbits diminish so rapidly with depth
that at a depth of half the wavelength the orbits are only 4 per cent as large
as those at the surface. Surface waves move at a speed in miles per hour
roughly equal' to 3.5 times the period in seconds. Thus a wave with a period of
10 seconds will travel about 35 miles per hour. This is the average period of
the swell reaching
Waves and the Shore
As the waves approach shore they reach water
shallower than half their wavelength. Here their velocity is controlled by the
depth of the water, and they are now called shallow-water waves. Wavelength
decreases, height increases and speed is reduced; only
the period is unchanged. The shallow bottom greatly modifies the waves. First,
it refracts them, that is, it bends the wave fronts to approximate the shape of
the underwater contours. Second, when the water becomes critically shallow,
the waves break [see illustration on page
11].
Even the most casual
observer soon notices the process of refraction. He sees that the larger waves
always come in nearly parallel to the shoreline, even though a little way out
at sea they seem to be approaching at an angle. This is the result of wave
refraction, and it has considerable geological importance because its effect
is to distribute wave energy in such a way as to straighten coastlines. Near a
headland the part of the wave front that reaches shallow water first is slowed
down, and the parts of
it in relatively deep water continue to move rapidly. The wave
thus bends to converge on the headland from all sides. As it does, the energy
is concentrated in less length of crest; consequently the height of the crest
is increased. This accounts for the old sailors'
saying: "The points draw the waves."
Another segment of the same
swell will enter an embayment and the wave front will become elongated so that
the height of the waves at any point along the shore is correspondingly low.
This is why bays make quiet anchorages and exposed promontories are subject to
wave battering and erosion-all by the same waves. One can deal quantitatively
with this characteristic of waves and can plot the advance of any wave across
waters of known depths. Engineers planning shoreline structures such as
jetties or piers customarily draw refraction diagrams to determine in advance
the effect of waves of various periods and direction. These diagrams show
successive
positions of the
wave front, partitioned by orthogonals into zones
representing equal wave energy [see
illustration on next page]. The ratio of the distances between such zones
out at sea and at the shore is the refraction coefficient, a convenient means
of comparing energy relationships.
Refraction studies must take into account surprisingly small
underwater irregularities. For example, after the
During World War II it was necessary to determine the depth of
water off enemy-held beaches against which amphibious landings were planned.
Our scientists reversed the normal procedure for refraction studies; by
analyzing a carefully timed series of aerial photographs for the changes in
length (or velocity) and direction of waves approaching a beach, they were
able to map the underwater topography.
The final transformation of normal swell by shoal or shallow
water into a breaker is an exciting step. The waves have been shortened and
steepened in the final approach because the bottom has squeezed the circular
orbital motion of the particles into a tilted ellipse; the particle velocity in
the crest increases and the waves peak up as they rush landward. Finally the
front of the crest is unsupported and it collapses into the trough. The wave
has broken and the orbits exist no more. The result is surf.
If the water continues to get shallower, the broken wave
becomes a foam line, a turbulent mass of aerated water. However, if the broken
wave passes into deeper water, as it does after breaking on a bar, it can form
again with a lesser height that represents the loss of energy in breaking. Then
it too will break as it moves into a depth critical to its new height.
The depth of water beneath a breaker, measured down from the
still-water level, is at the moment of breaking about 1.3 times the height of
the breaker. To estimate the height of a breaker even though it is well
offshore, one walks from the top of the beach down until the crest of the
breaking wave is seen aligned with the horizon. The vertical distance between
the eye and the lowest point to which the water retreats on the face of the
beach is then equal to the height of the wave.
The steepness of the bottom
influences.
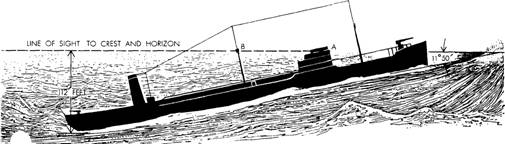
WAVE 112 FEET HIGH, possibly
the largest ever measured in the open sea, was en. countered
in the Pacific in 1933 by the U.S.S. Ramapo,
a Navy tanker. This diagram shows how the great wave was measured. An observer
at A on the bridge was looking toward the stern and saw the crow's-nest at B in
his line of sight to crest of wave, which had just come in line with horizon.
From geometry of situation, wave height was calculated.
the character of the breakers.
When a large swell is forced by an abrupt underwater slope to give up its
energy rapidly, it forms plunging breakers-violent waves that curl far over,
flinging the crest into the trough ahead. Sometimes, the air trapped by the
collapsing wave is compressed and explodes with a great roar in a geyser of
water [see illustration on opposite
page]. However, if the bottom slope is long and gentle, as at Waikiki in
Since waves are a very effective mechanism for transporting
energy against a coast, they are also effective in doing great damage. Captain
D. D. Gaillard of the U. S. Army Corps of Engineers devoted his career to
studying the forces of waves on engineering structures and in 1904 reported
some remarkable examples of their destructive power. At
lighthouse-keeper's house, the floor of which is 91 feet above the water, and
fell back through the roof to wreck the interior.
At
![]()
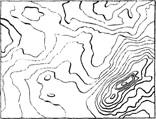
WAVE-REFRACTION DIAGRAM shows how energy of
wave front at A is all concentrated by refraction at A' around small headland
area. Same energy at B enters a bay but is spread at beach over wide area B'. -Horizontal
lines are wave fronts; vertical lines divide energy into equal units for
purposes of investigation. Such studies are vital preliminaries to design of
shoreline structures.
Tsunamis
Even more destructive than wind generated
waves are those generated by a sudden impulse such as an underwater
earthquake, landslide or volcano. A man-made variation of the sudden impulse
is the explosion of nuclear bombs at the surface of the sea, which in recent
years have become large enough to be reckoned with as possible causes of destructive
waves.
The public knows such waves as
tidal waves, although they are in no way related to the tides and the
implication has long irritated oceanographers. It was proposed that the
difficulty could be resolved by adopting the Japanese word tsunami. Some time
later it was discovered that Japanese oceanographers are equally irritated by
this word; in literal translation tsunami means tidal wave! However, tsunami
has become the favored usage for seismic sea waves.
Like the plunger in a wave
channel, the rapid motion or subsidence of a part of the sea bottom can set a
train of waves in motion. Once started, these waves travel great distances at
high velocity with little loss of energy. Although their height in deep water
is only a few feet, on entering shallow water they are able to rise to great
heights to smash and inundate shore areas. Their height depends almost
entirely on the configuration of the coastline and the nearby underwater
contours. Tsunamis have periods of more than 15 minutes and wavelengths of
several hundred miles. Since the depth of water is very much less than half the
wavelength, they are regarded as longer shallow-water waves, even in the
13,000-foot average depth of the open ocean, and their
velocity is limited by the depth to something like 450 miles per hour.
These fast waves of great destructive
potential give no warning except that the disturbance that causes them can be
detected by a seismograph. The U. S. Cast Guard operates a tsunami warning
network in the Pacific that tracks all earthquakes, and when triangulation indicates
that a quake has occurred at sea, it issues alerts. The network also has devices
to detect changes in wave period which may indicate that seismic waves are
passing [see "Tsunamis," by Joseph Bernstein; SCIENTIFIC AMERICAN,
August, 1954. Curiously the influence of the system may not be entirely
beneficial.
Once when an alert was broadcast at
Certain coasts near zones of
;wrest in the earth's crust are particularly prone to such
destructive waves, especially the shores of the Mediterranean, the Caribbean
and the west coast of
A well-known seismic sea wave,
thoroughly documented by the Royal Society of London, originated with the
eruption of the volcano Krakatoa in the
A tsunami on April 1, 1946, originating with
a landslide in the Aleutian submarine trench, produced similar effects,
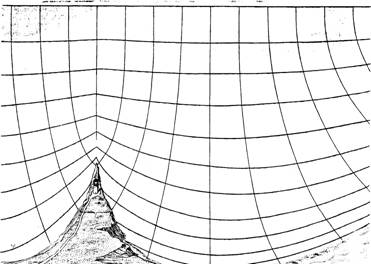
WAVE-CREATED "GEYSER" results when large breakers
smash into a very steep beach. They curl over and collapse, trapping and
compressing air. This compressed air then explodes as shown here. with spray from a 12-fool breaker leaping 50 feet into the
air.
0
WAVE
BREAKS UP at the beach when swell moves into water shallower than half the
wavelength (1). The shallow bottom raises wave height and decreases length (2).
At a water depth 1.3 times the wave height, water supply is reduced and the
particles of water
in
the crest have no room to complete their cycles; the wave form breaks (3). A
foam line forms and water particles, instead of just the wave form, move
forward (4). The low remaining wave runs up the face of the beach as a gentle
wash called the uprush (5).
fortunately on
less-populated shores. It struck hard at the
Uncontrollable geologic
disturbances will cause many more seismic sea waves in the future, and since
the world's coastal population is continuously increasing, the greatest wave
disaster is yet to come. Within the next century we can expect that somewhere a
wave will at least equal the one that swept the shores of the
Tides and Other Waves
The rhythmic rise and fall of the sea level on a coast indicate the
passage of a true wave we call a tide. This wave is driven, as almost everyone
knows, by the gravitational influence of the sun and the moon. As these bodies
change their relative positions the ocean waters are attracted into a bulge
that tends to remain facing the moon as the earth turns under it; a similar
bulge travels around the earth on the opposite side. The wave period therefore
usually corresponds to half the lunar day.
When the sun and the moon are aligned with the earth, the
tides are large (spring tides) ; when the two bodies are at right angles with
respect to the earth, the tides are small (neap tides). By using astronomical
data it is possible to predict the tides with considerable accuracy. However,
the height and time of the tide at any place not on the open coast are
primarily a function of the shape and size of the connection to the ocean.
Still another form of wave is a seiche,
a special case of wave reflection. All enclosed bodies of water rock with
characteristics related to the size of the basin. The motion is comparable to
the sloshing of water in the bathtub when one gets out quickly. In an attempt
to return to stability the water sways back and forth with the natural period
of the tub (mine has a period of two seconds). Similarly a tsunami or a
barometric pressure-change will often set the water in a bay rocking as it
passes. In fact, the tsunami itself may reflect back and forth across the
ocean as a sort of super-seiche.
In addition to seiches, tides,
tsunamis and wind waves there are other waves in the sea. Some travel hundreds
of feet beneath the surface along the thermocline,
the interface between the cold deep water and the relatively warm surface layer.
Of course these waves cannot be seen, but thermometers show that they are
there, moving slowly along the boundary between the warm layer and the denser
cold water. Their study awaits proper instrumentation. Certain very low waves,
with periods of several minutes, issue from storms at sea. These long-period
"forerunners" may be caused by the barometric pulsation of the entire
storm against the ocean surface. Since they travel at hundreds of miles an
hour, they could presumably be used as storm warnings or storm-center locators.
Other waves, much longer than tides, with periods of days or weeks and heights
of less than an inch, have been discovered by statistical methods and are now
an object of study.
The great advances both in wave theory and in
the actual measurement of waves at sea have not reduced the need for extensive
laboratory studies. The solution of the many complex engineering problems that
involve ships, harbors, beaches and shoreline structures requires that waves
be simulated under ideal test conditions. Such model studies in advance of
expensive construction permit much greater confidence in the designs.
Experimental Tanks
The traditional wave channel in which an endless train of
identical small waves is created by an oscillating plunger is still in use,
but some of the new wave tanks are much more sophisticated. In some the channel
is covered, so that a high velocity draft of air may simulate the wind in
making waves. In others, like the large tank at the Stevens Institute of
Technology in
The ripple tank, now standard apparatus for teaching physics,
has its place in shoreline engineering studies for conveniently modeling
diffraction and refraction. Even the fast tsunamis and the very slow waves of
the ocean can be modeled in the laboratory. The trick is to use layers of two
liquids that do not mix, and create waves on the interface between them. The
speeds of the waves can be controlled by adjusting the densities of the
liquids.
To reduce the uncertainties in extrapolation
from the model to prototype, some of the new wave tanks are very large. The
tank of the Beach Erosion Board in
The AuthorWILLARD
BASCOM served on the staff of the National Academy of Sciences as executive
secretary of the Maritime Research Advisory Committee and (lately) of the
AMSOC Committee, which first nurtured the project of drilling a
"Mohole" through the earth's subcrustal Mohorovicic discontinuity. Bascom
is a native New Yorker who in the years before World War II learned geology
during alternate periods of work as a miner and as a student at the Colorado
School of Mines, which he left a few months short of his degree in order to
become a mining engineer in
THE OCEANS: THEIR PHYSICS, CHEMISTRY
AND GENERAL BIOLOGY. H. U. Sverdrup, Martin W. Johnson and Richard H. Fleming.
Prentice-Hall, Inc., 1942.
PRACTICAL METHODS FOR OBSERVING
AND FORECASTING OCEAN WAVES BY MEANS OF WAVE SPECTRA AND STATISTICS. Willard J. Pierson, Jr., Gerhard Neumann and Richard W. James.
Hydrographic Office Publication No. 603, 1958.

Biography of Willard Bascom
Willard Bascom has been
described as an ocean engineer, diver, and ocean adventurer. He had wide-ranging
interests, demonstrated extreme independence, had impatience with orthodox
viewpoints. He has been described as a maverick innovator, passionate about art
and science. He studied poetry, music, painting (an avid oil painter, with an
affinity for seascapes and landscapes), photography, cinematography, and
underwater archaeology.
Willard Bascom was born
in
Willard Bascom’s career
in ocean science began in 1945 when he joined John Isaacs to work as a research
engineer, conducting studies of waves and beaches first at
During the expedition,
Willard was diagnosed with bone cancer. As a result, he took unreasonable risks
as the ships dredged the seafloor. Subjecting himself to the largest amount of
radiation ever given a person, he completely recovered after about four years.
In 1954, Willard joined
the staff at the National Science Foundation, where he organized and directed
the first phase of Project Mohole (involving SIO and other institutions), the
first effort to drill in deep water through the earth’s crust. Drilling was
conducted in 1961 at depths of 11,700 ft near Guadalupe I., Mex. (the previous
depth record was 400 ft). It collected samples of earth’s ‘second layer’ and
measured the temperature increase 600 ft below the bottom of the seafloor. His
involvement in this project resulted in book (see below) and Steinbeck wrote an
article about it for Life magazine. The project was abandoned in 1966
because the ever-increasing costs failed to gain congressional approval.
However, the Mohole Project laid the foundations for the Deep-sea Drilling
Project, which incorporated Project Mohole’s ship positioning and design as
well as its drilling technology.
In 1962, Willard Bascom
founded Ocean Science and Engineering, Inc., and became its president. He
pioneered undersea exploration for diamonds, discovering about 20 million
carats of gem diamonds for De Beers diamond company in underwater areas off the
coasts of
While at Ocean Science
and Engineering, Willard Bascom founded Seafinders, Inc., in 1972 and discovered an long lost wreck of
a Spanish galleon, Nuestra Señora de la Maravillas.
Willard Bascom was the
director of the Southern California Coastal Water Research Project (SCCWRP)
from 1973-1984. During this period he helped establish SCCWRP as an ocean
research organization, with a focus on marine pollution problems of southern
In 1980 he received the
Explorer’s Club (
After leaving SCCWRP in
1985, Willard resumed his undersea search ventures in
Willard Bascom was the
author of several books and many scientific papers (including many in Scientific
American). Some of his books include Waves and beaches, A hole in
the bottom of the sea (1961) (describing the Mohole Project he directed),
Great sea poetry (included works by Rudyard Kipling and others), Deepsea
archaeology, Deepsea salvaging, The crest of the wave (1988),
The gold of Brother Jonathan (about his recovery of gold from a
Civil-war era sidepaddle steamer which sunk off northern California.
Sources
SIO.
2000. In memoriam. SIO Log, 37(38), Sept. 29
Williams, Jack. 2000. Willard Bascom, 83; maverick
oceanographer, deep-sea explorer.
Additional information
from SCCWRP staff recollections
IN MEMORIAM
WILLARD
N. BASCOM
1916-2000
We are sad to report the death of Willard
N. Bascom, our second director, who led the Southern California Coastal Water Research Project from
1973 to 1984. He died on September 20, 2000 at his home as a result of
infections resulting from multiple fractures sustained in a car accident in
June 2000.
"Willard
Bascom had a momentous impact on my life and career.
His passing hasn't sunk in yet. Last year he invited me to
Alan
Mearns
Student, National Oceanic and Atmospheric Administration
Seattle
10 TSUNAMI
(tsoo-nah-mee)
What
does "tsunami" mean?
Tsunami is a Japanese word with the English
translation, "harbor wave." Represented by two characters, the top
character, "tsu," means harbor, while the bottom character, "nami,"
means "wave." In the past, tsunamis were sometimes referred to as
"tidal waves" by the general public, and as "seismic sea
waves" by the scientific community. The term "tidal wave" is a
misnomer; although a tsunami's impact upon a coastline is dependent upon the
tidal level at the time a tsunami strikes, tsunamis are unrelated to the tides.
Tides result from the imbalanced, extraterrestrial, gravitational influences of
the moon, sun, and planets. The term "seismic sea wave" is also
misleading. "Seismic" implies an earthquake-related generation
mechanism, but a tsunami can also be caused by a nonseismic event, such as a
landslide or meteorite impact.
How
do tsunamis differ from other water waves?
Tsunamis are unlike wind-generated waves, which
many of us may have observed on a local lake or at a coastal beach, in that
they are characterized as shallow-water waves, with long periods and wave
lengths. The wind-generated swell one sees at a
As a result of their long wave lengths, tsunamis
behave as shallow-water waves. A wave becomes a shallow-water wave when the
ratio between the water depth and its wave length gets very small.
Shallow-water waves move at a speed that is equal to the square root of the
product of the acceleration of gravity (9.8 m/s/s) and the water depth - let's
see what this implies: In the Pacific Ocean, where the typical water depth is
about 4000 m, a tsunami travels at about 200 m/s, or over 700 km/hr. Because
the rate at which a wave loses its energy is inversely related to its wave
length, tsunamis not only propagate at high speeds, they can also travel great,
transoceanic distances with limited energy losses.
This
animation shows the propagation of the earthquake-generated 1960 Chilean tsunami
across the Pacific. Note the vastness of the area across which the tsunami
travels -
What
happens to a tsunami as it approaches land?
As a tsunami leaves the deep water of the open ocean
and travels into the shallower water near the coast, it transforms. If you read
the "How do tsunamis differ from other water waves?" section, you
discovered that a tsunami travels at a speed that is related to the water depth
- hence, as the water depth decreases, the tsunami slows. The tsunami's energy
flux, which is dependent on both its wave speed and wave height, remains nearly
constant. Consequently, as the tsunami's speed diminishes as it travels into
shallower water, its height grows. Because of this shoaling effect, a tsunami,
imperceptible at sea, may grow to be several meters or more in height near the
coast. When it finally reaches the coast, a tsunami may appear as a rapidly
rising or falling tide, a series of breaking waves, or even a bore.
Tsunamis rarely transform into the great, towering
breaking waves many of us imagine. In video footage taken in
Sometimes a tsunami may break far offshore, out in
deeper water than the wind-generated swell typically breaks.
As a tsunami propagates from open water into an
abruptly shallower bay or river, it may form into a bore. A bore is a step-like
wave with a steep breaking face connecting the undisturbed water in front of
the bore with the deeper water behind it.
What
happens when a tsunami encounters land?
As a tsunami approaches shore, we've learned in
the "What happens to a tsunami as it approaches land?" section that
it begins to slow and grow in height. Just like other water waves, tsunamis
begin to lose energy as they rush onshore - part of the wave energy is
reflected offshore, while the shoreward-propagating wave energy is dissipated
through bottom friction and turbulence. Despite these losses, tsunamis still
reach the coast with tremendous amounts of energy. Tsunamis have great
erosional potential, stripping beaches of sand that may have taken years to
accumulate and undermining trees and other coastal vegetation. Capable of
inundating, or flooding, hundreds of meters inland past the typical high-water
level, the fast-moving water associated with the inundating tsunami can crush
homes and other coastal structures. Tsunamis may reach a maximum vertical
height onshore above sea level, often called a runup height, of 10, 20, and
even 30 meters.
During the 1993
1957 Aleutian Tsunami
On March 9, 1957, at 14:22 GMT, an earthquake
occurred south of the
First photo in a series of three sequential photos
show the arrival of a major wave at Laie Point on the Island of Oahu, Hawaii
about 3,600 km from the source. The Island of Kauai, Hawaii, was hit twice as
hard by this tsunami than by the
Second photo in a series of three sequential
photos show the arrival of a major wave at Laie Point on the Island of Oahu,
Hawaii. Although the northwest side of the
1964
On March 28, 1964, at 03:28 GMT, an earthquake
occurred in Prince William Sound of Alaska triggering a Pacific-wide tsunami.
The earthquake had a surface-wave magnitude of 8.4, an epicenter of 61.1° N,
147.5° W, and a depth of 23 km. The earthquake, local tsunamis due to
landslides, and the regional tsunami were responsible for taking the lives of
more than 122 people and causing over $106 million in damage. The Surge wave left a 2 x 12 in. (5.2 x 31
cm) plank in a truck tire at
1975 Hawaiian Tsunami
On November
29, 1975, at 14:48 GMT, an earthquake occurred off the coast of the
At Halape, of the 32 campers 19 suffered injuries
and 2 died. It was the sounds of the falling rocks from the cliff and the
trembling that caused the campers to awake and a few moved to a coconut grove
that was closer to the ocean. The campers were awaken by a second quake that
sent large boulders down the cliff and forced the rest of the campers to flee
toward the sea. However, these campers were forced back to cliffs when the
campers at the coconut grove fleeing the rising ocean with cries of tsunami.
The first wave that alarmed the campers was only 1.5 m. The second wave,
however, was 7.9 m carried campers into a ditch near the base of cliff where
they remained until the ordeal ended. Two of the campers were not so lucky and
died. The coconut grove that a few campers took shelter in received permanent
subsidence between 3.0 and 3.5 meters.
The largest recorded run-up was 14.3 m at
In the case of earthquake-generated tsunamis, the
water column is disturbed by the uplift or subsidence of the sea floor.
Submarine landslides, which often accompany large earthquakes, as well as
collapses of volcanic edifices, can also disturb the overlying water column as
sediment and rock slump downslope and are redistributed across the sea floor.
Similarly, a violent submarine volcanic eruption can create an impulsive force
that uplifts the water column and generates a tsunami. Conversely, supermarine
landslides and cosmic-body impacts disturb the water from above, as momentum
from falling debris is transferred to the water into which the debris falls.
Generally speaking, tsunamis generated from these mechanisms, unlike the
Pacific-wide tsunamis caused by some earthquakes, dissipate quickly and rarely
affect coastlines distant from the source area.
In June and October 1994 two major undersea
earthquakes occurred, the first near
The
Tsunami Warning System:An international effort to save lives and
protect property
Overview
of the Tsunami Warning System
The Tsunami Warning System (TWS) in the Pacific,
comprised of 26 participating international Member States, has the functions of
monitoring seismological and tidal stations throughout the
Tsunami
Warning Centers
As part of an international cooperative effort to
save lives and protect property, the National Oceanic and Atmospheric
Administration's (NOAA) National Weather Service operates two tsunami warning
centers. The Alaska Tsunami Warning Center (ATWC) in Palmer,
The
Tsunami
Watch and Warning Determination
The objective of the PTWS is to detect, locate,
and determine the magnitude of potentially tsunamigenic earthquakes occurring
in the
If a significant tsunami is detected by sea-level
monitoring instrumentation, the tsunami warning is extended to the entire
Tsunami
Warning Dissemination
Tsunami watch, warning, and information bulletins
are disseminated to appropriate emergency officials and the general public by a
variety of communication methods.
* Tsunami
watch, warning and information bulletins issued by PTWC and ATWC are
disseminated to local, state, national and international users as well as the
media. These users, in turn, disseminate the tsunami information to the public,
generally over commercial radio and
television channels.
* The
NOAA Weather Radio System, based on a large number of VHF transmitter sites,
provides direct broadcast of tsunami information to the public.
* The
* Local authorities and emergency managers
are responsible for formulating and executing evacuation plans for areas under
a tsunami warning. The public should stay-tuned to the local media for evacuation orders
should a tsunami warning be issued. And, the public should NOT RETURN to
low-lying areas until the tsunami threat has passed and the "all
clear" is announced by the local authorities.
Marine
Science Reading Program 3
Name____________________________________________pd_____
8. A Wave is Born
___1. According to "A Wave Is Born: How Winds
Power and Shape the Surf," the main energy source of waves is: a. earthquakes. b. wind.
c. volcanoes. d. landslides.
___2. As noted in "A Wave Is Born: How Winds
Power and Shape the Surf," if the crests of two sets of swells intersect,
they will combine into one set of gigantic swells called:
a.
killer waves. b. spindrifts. c. rogue waves. d. whitecaps.
___3. As
reported in "A Wave Is Born: How Winds Power and Shape the Surf,"
most swells do not pass close to land.
a. true b. false
4. What is the main idea of this article?
9 . OCEAN
WAVES
READ THE ARTICLE THEN ANSWER THE QUESTIONS TRUE OR
FALSE
......1.
Waves may form from the friction of the wind on the surface but not from
air pressure changes
......2.
The size of the waves is dependent upon wind speed, length of time the
wind blows, and the distance over which the wind blows
.....3.
While a wave may move past a point, the water making up the wave will
show no net movement
.....4.
Water particles in a wave tend to move in circles
......5.
Waves seldom travel more than a few miles
.......6.
Waves "break" because the bottom causes the water
particles to move past the wave
.......7.
Tides are very different from waves
......8.
The much smaller size of the moon makes it have less of an influence on
tides than the sun
......9. At
any one time two high tides occur because of the difference in centrifugal
force and gravitational attraction
......10.
Earthquakes and similar occurrences can cause waves
.......11.
Waves are ecologically important
.......12.
Waves may keep the upper portion of the intertidal area wet
.......13.
Tides can be predicted from knowledge of the positions and phases of the
moon and sun
......14. The height and time of tides is the same
from month to month
.......15.
Natural disasters can have an influence on waves
.......16.
Wave action may influence the types of organisms found on a beach
.......17.
Organisms in the intertidal zone would be expected to show special
adaptations due to their physical environment
.......18.
As one proceeds up the beach one might expect to see a change in the
species composition present
.......19.
The mechanisms controlling tidal action are complex and interrelated
.......20.
While waves may travel thousands of miles, the water particles with it
may even travel farther
......21.
All waves are basically similar
......22.
Wave action has little influence on those organisms in the wave zone
......23.
Tidal action places a stress on the organisms which live in the tidal
zone due to alternate drying and wetting.
10. TSUNAMI
READING QUESTIONS
1.What
does tsunami mean?
2. How is a tsunami (A) the same as (B) different than regular ocean waves?
3. What happens to a tsunami as it travels into
shallow water?
4. How would a tsunami appear to an onlooker in
(A) the open ocean (B) along the shore?
5. What is meant by the term run-up?
6. How does the run-up affect the shoreline?
7. During the Prince William Sound Tsunami in
1964, what was the largest wave that hit?
(in feet)
8. How long did it take for this tsunami in 1964
to reach (A)
9. What caused the 67m run-up at Valdez Inlet in
1964?
10. How high was the splash-up at
11. Where are the two tsunami warning centers and
what locations do they cover?
12.
What is the objective of PTWS?
13. How are Tsunami warnings disseminated?
14. How
would this system still not be able to warn people of a tsunami in time?