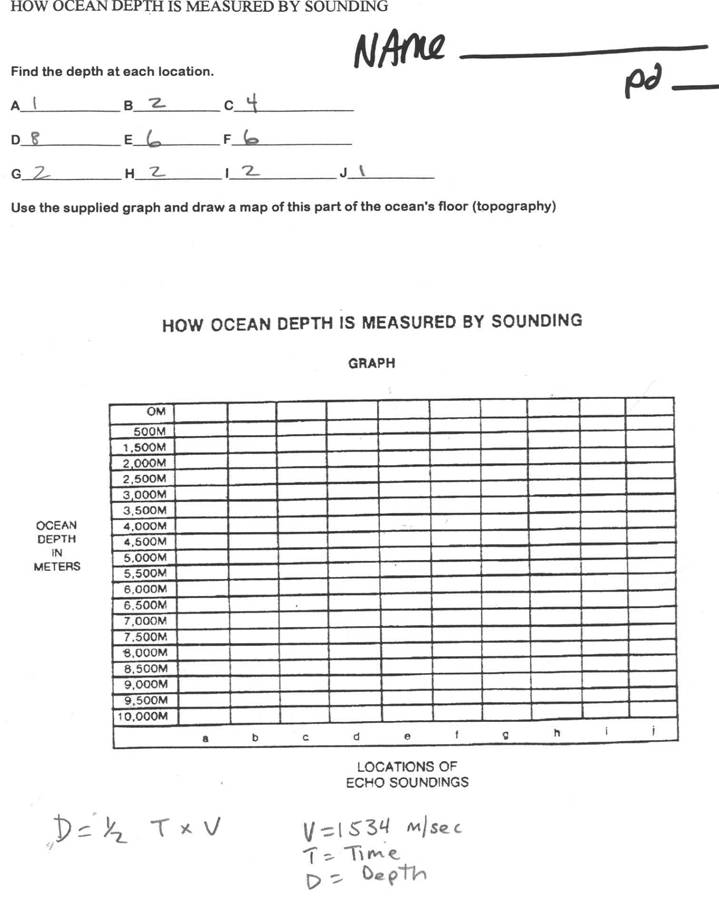
Location A. 1st signal...........1 second
Location B. 2nd signal...........2 seconds
Location C. 3rd signal...........4 seconds
Location D. 4th signal...........8 seconds
Location E. 5th signal...........6 seconds
Location F. 6th signal...........4 seconds
Location G. 7th signal...........2 seconds
Location H. 8th signal...........2 seconds
Location I. 9th signal...........2 seconds
Location J. 10th signal...........1 second
Find the depth at each location.
A_______________ B_____________
C__________________
D_______________ E_____________
F__________________
G_______________ H_____________ I________________
J____________
Use the supplied graph and draw a map of this part
of the ocean's floor (topography)
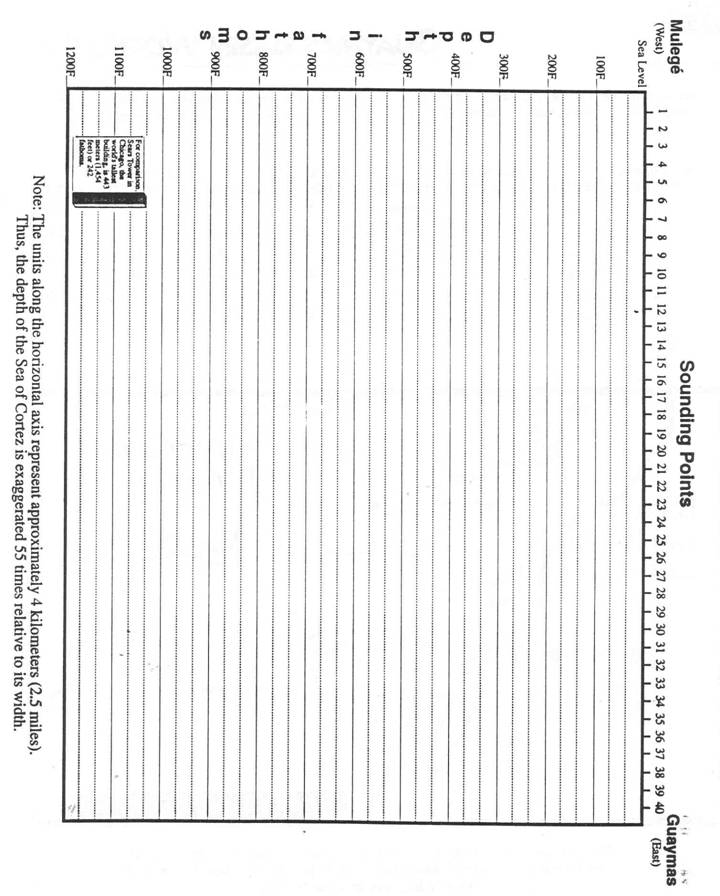
Making and Ocean Profile
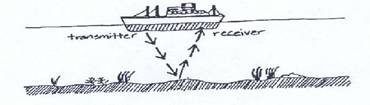
Imagine you are the sonar crew working with
the world famous oceanographer, Captain Jacques Yves Cousteau of the sailing
ship Calypso. Your scientific mission
is to chart the Atlantic sea floor along 39°N latitude. You set sail from Atlantic City, New Jersey
and traverse the mighty ocean to your destination in Lisbon, Portugal.
Along the way, you use your sophisticated sonar to probe the unseen depths
below. You collect a wealth of data on the depth of the ocean floor, which is
in the table on the next page. Now, you will use that data to create a graph
and profile of the ocean bottom. Good luck, and may the seas be kind to you...
Set
up Your Graph Paper
Take time to make sure that your graph paper is
properly set up. A well-designed graph includes the following:
1.
A title
that identifies your data
2. An x-axis and a y-axis
3. Axis labels including metric units
4. Well-chosen number scales along each axis
Here are some questions
to help design your graph:
1. What data and label go along the x-axis?
2. What data and label
go along the y-axis?
3. If we are plotting
depth below the ocean surface, where
should we put zero on the y-axis?
Plot
Your Data
Plot each point in the data table on your graph.
Once all of the points are plotted, connect
the points with straight lines. This will give you a profile of the
changing depth of the ocean as you travel along 39°N latitude in the Atlantic Ocean from west to east.
Analyze Your Data
Research ocean floor
features in your textbook, in the library, on the Internet, or from your class
notes. On your graph, identify and label the following features: Continent, Continental Shelf, Continental
Slope, Abyssal Plain, Mid-Ocean Ridge, Island,
and Seamount. Note that this
traverse does not cross any Trenches.
Answer
the Following:
1.
What ocean floor structure occurs
between 0 and 160 km east of New
Jersey?______________
2.
What ocean floor structure occurs
between 160 and 1050 km east of New
Jersey?______
3.
What ocean floor structure occurs
between 1000 and 2000 km east of New
Jersey?_____
4.
What ocean floor structure occurs
between 2000 and 3000 km east of New
Jersey?_____
5.
What is the scale of your x-axis? 1
unit =
6.
What is the scale of your y-axis? 1
unit =
7. If you wanted to draw your profile to scale, the units and
distances along both your x-axis and y-axis would have to be the same. Your
profile as it is drawn now is exaggerated. To find the vertical exaggeration, divide your x-axis by your y-axis.
What
is the exaggeration?_________________________________________________
8.
If you drew your profile to scale, about how long a sheet of paper would you
need?_________
|
Atlantic
Ocean Profile Data along 39°N Latitude
|
|
Sonar
Reading
|
Distance
from
New Jersey (km)
|
Depth to
Ocean Floor
(m)
|
|
1
|
0
|
0
|
|
2
|
160
|
165
|
|
3
|
200
|
1800
|
|
4
|
500
|
3500
|
|
5
|
800
|
4600
|
|
6
|
1050
|
5450
|
|
7
|
1450
|
5100
|
|
8
|
1800
|
5300
|
|
9
|
2000
|
5600
|
|
10
|
2300
|
4750
|
|
11
|
2400
|
3500
|
|
12
|
2600
|
3100
|
|
13
|
3000
|
4300
|
|
14
|
3200
|
3900
|
|
15
|
3450
|
3400
|
|
16
|
3550
|
2100
|
|
17
|
3600
|
1330
|
|
18
|
3700
|
1275
|
|
19
|
3950
|
1000
|
|
20
|
4000
|
0
|
|
21
|
4100
|
1800
|
|
22
|
4350
|
3650
|
|
23
|
4500
|
5100
|
|
24
|
5000
|
5000
|
|
25
|
5300
|
4200
|
|
26
|
5450
|
1800
|
|
27
|
5500
|
920
|
|
28
|
5600
|
180
|
|
29
|
5650
|
75
|
|
30
|
5700
|
0
|
|
|
|
|
Fill in the Blank Name:______________________________ Class: Date:
Fill in the blanks in these sentences with the
word that fits.
1. _____________ is a sediment
deposited by currents with the large rocks at the bottom and the fine material
at the top.
2. Land deposits found in the deep sea are
called______________________________________
3. The continental________________is a zone
subdivided into shelf, slope, and rise.
4. The sinking of a broad area of crust without
much change is___________________________
5. A unit of__________ equal to about 6 feet is fathom.
6. A trench is a narrow,________,
ocean valley.
7 _____ _________ooze is produced from the
accumulation of diatoms on the sea floor.
8. Soundings are depth____________ of the ocean basin.
9. Gently sloping zone bordering a continent is the ____________shelf.
10. The rounded, layered lumps found on the ocean floor;
contains 20% _______with
some iron, nickel, and copper.________________
11. A flat topped, submerged seamount is a ______________
12. The steep_______________angle from the shelf
break to the abyssal plain.
13. A device that plunges a hollow tube into
bottom sediments to remove a verticle sample is a ______________
14. A___________________volcanic peak of more than
1000m is a seamount.
15. An island arc is a chain of islands formed
where plates_______________________
16. _________________ are hills of less
than 1000m found on the abyssal plain.
17. A transform fault that is___________________ to a ridge or rise.
18. The flat ocean floor is
the_____________________________
19.___________ is the transport of sediments such
as rocks, sand, and gravel from land matter out to sea by wind, water, and ice.
20. The rise is a gentle slope formed by
the_____________________ of sediments at the base of the slope.
Select your answers from the followinq words:
deposit
continental measurements Rafting subsidence margin steep-sided abyssal plain Downward length Turbidite perpendicular guyot Abyssal hills pelagic sediments submarine Diatomaceous corer converge manganese