|
1
|
|
|
2
|
- Create a performance baseline
- Understand the performance and monitoring tools found in Windows XP
Professional
- Create a counter log for historical analysis
- Create Alert events to warn of performance problems
- Detect and eliminate bottlenecks
|
|
3
|
- Baseline
- Definition of what a normal load looks like on a computer system
- In object-oriented parlance, objects have properties
- In Windows operating systems, some of these properties are called counters
because they count, average, or otherwise monitor specific events,
activities, or behavior of the objects with which they’re associated
|
|
4
|
- When it comes to system analysis, there are two primary activities
involved in tackling performance-related issues:
- Monitoring
- Requires a thorough understanding of system components, their
behavior, and how they interact
- Performance tuning
- Consists of changing a system’s configuration systematically and
carefully observing performance before and after such changes
|
|
5
|
|
|
6
|
- Process
- An environment that defines the resources available to threads
- Thread
- Minimum unit of system execution and corresponds roughly to a task
within an application
- Handle
- Indicates an internal identifier for some kind of system resource,
object, or other component that must be accessed by name (or through a
pointer)
|
|
7
|
|
|
8
|
|
|
9
|
|
|
10
|
- System Monitor
- Utility that tracks registered system or application objects, where
each such object has one or more counters that can be tracked for
information about system behavior
- A graphical tool that can monitor different events concurrently
|
|
11
|
|
|
12
|
- Realtime monitoring is the process of viewing the measured data from one
or more counters in the System Monitor display area
- System Monitor can display realtime and logged data in one of three
formats:
- Graph
- Histogram (thermometer bars)
- Report (text-based values)
|
|
13
|
|
|
14
|
|
|
15
|
- Performance object and counter pairs worth memorizing:
- LogicalDisk: Current Disk Queue Length
- LogicalDisk: %Disk Time
- LogicalDisk: Disk Bytes/Transfer
- Memory Available Bytes
- Memory: Cache Faults/sec
|
|
16
|
- Performance object and counter pairs worth memorizing (cont.):
- Memory: Page Faults/sec
- Memory: Pages/sec
- Network Interface: Bytes Total/sec
- Network Interface: Current Bandwidth
|
|
17
|
- Performance object and counter pairs worth memorizing (cont.):
- Network Interface: Output Queue Length
- Network Interface: Packets/sec
- PhysicalDisk: Current Disk Queue Length
- PhysicalDisk: % Disk Time
|
|
18
|
- Performance object and counter pairs worth memorizing (cont.):
- PhysicalDisk: Avg. # Disk Bytes/Transfer
- Processor: % Processor Time
- Processor: Interrupts/sec
- System: Processor Queue Length
|
|
19
|
|
|
20
|
|
|
21
|
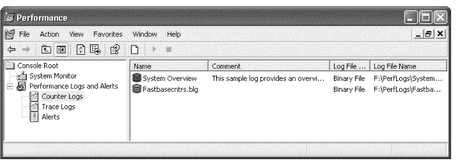
- Counter log
- Records measurements on selected counters at regular, defined intervals
- Allows you to define exactly which counters are recorded
- Trace log
- Records data only when certain events occur
- Record nonconfigurable data from a designated provider when an event
occurs
|
|
22
|
|
|
23
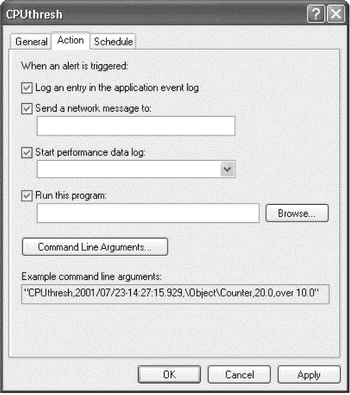
|
- Automated watchdog that informs you when a counter crosses a defined
threshold, high or low
|
|
24
|
|
|
25
|
- Tracks all events generated by the operating system as well as security
and application events
|
|
26
|
|
|
27
|
|
|
28
|
- Windows XP Professional uses 32 levels of application priority, numbered 0 (zero) to 31, to
determine which process should gain access to the CPU at any given
moment
- There are two techniques available to users and administrators to
manipulate process priorities:
- Manage already running processes using Task Manager
- Use the Start command to launch processes with specific priority
settings
|
|
29
|
|
|
30
|
|
|
31
|
- Bottleneck
- System resource or device that limits a system’s performance
- Ideally, the user should be the bottleneck on a system, not any
hardware or software components
- There is no single bottleneck monitor that can easily identify all
possible problems
|
|
32
|
- Steps involved with finding and fixing computer system bottlenecks:
- Create a baseline
- Compare baseline observations to current system behavior
- Investigate the more common causes of system problems
|
|
33
|
- Steps involved with finding and fixing computer system bottlenecks
(cont.):
- If the list of “the usual suspects” does not produce an obvious
culprit, further analysis is required
- Once a potential bottleneck is identified, you make changes to the
system configuration to correct the situation
- Always test the impact of any fix you try
|
|
34
|
- Disk bottlenecks
- Caused by a limitation in a computer’s disk subsystem
- Memory bottlenecks
- Caused by a lack of available physical or virtual memory that results
in system slowdown or an outright system crash
|
|
35
|
- Processor bottlenecks
- Occurs when demands for CPU cycles from currently active processes and
the operating system cannot be met
- Network bottlenecks
- Caused by excessive traffic on the network medium to which a computer
is attached, or when the computer itself generates excessive amounts of
such traffic
|
|
36
|
- Buy a faster machine
- Upgrade an existing machine
- Install a faster CPU
- Add more L2 cache
|
|
37
|
- Add more RAM
- Replace the disk subsystem
- Increase paging file size
- Increase application priority
|
|
38
|
- Steps to take in ensuring optimal performance:
- Make sure the network interface appears higher in the binding order
than a modem or other slower link device
- Make sure file synchronization settings for folder redirection and
Offline Files do not require machines to synchronize when running in
battery
- Make sure your mobile users understand how to use hibernate and standby
modes on their battery-powered machines
|
|
39
|
- Steps to take in ensuring optimal performance (cont.):
- Make sure that all Offline Files a user might need are copied to his or
her machine before they leave the network environment
- Refresh rates also apply to Group Policy, which defaults to 90 minutes
on Windows XP
- For machines operating off-network, refresh rates should be extended
to avoid unnecessary network access
|
|
40
|
- Windows XP Professional provides a number of tools to monitor system
performance
- You can use Task Manager to view applications, processes, and overall
system performance, or to stop applications and processes
- The Performance console is an exceptionally useful collection of tools
that includes System Monitor, log files, and alerts
|
|
41
|
- The Event Viewer is a less dynamic but equally important tool that
tracks logs generated by the system
- Keep an eye on logs and performance counters to isolate any bottlenecks
that occur in the system
- Once a bottleneck is identified, take the steps necessary to remove it
and get the system running more smoothly
|
 Notes
Notes